MEASUREMENTS

Stray vibrations from loudspeakers can directly transmit into the surfaces of the room through contact with the floor. This causes the surfaces of the room to sympathetically radiate these vibrations as audible noise which can affect the music listening experience. The problem is further compounded by the large surface area of the room which radiates sound with a high efficiency. Low frequency vibrations are the worst offender due to their ability to travel throughout the structure of the room with little impedance.


Even with basic vibration isolation, these degrading effects of structure-borne vibrations can be mitigated. Placing vibration isolating audio footers under loudspeakers reduces reverberation time, vibration decay artifacts, and distortion at some frequencies[1]. Similar positive effects are experienced by isolating audio electronics from vibrations. The degree of these benefits can vary widely between audio footer designs.

Measuring Vibration Isolation

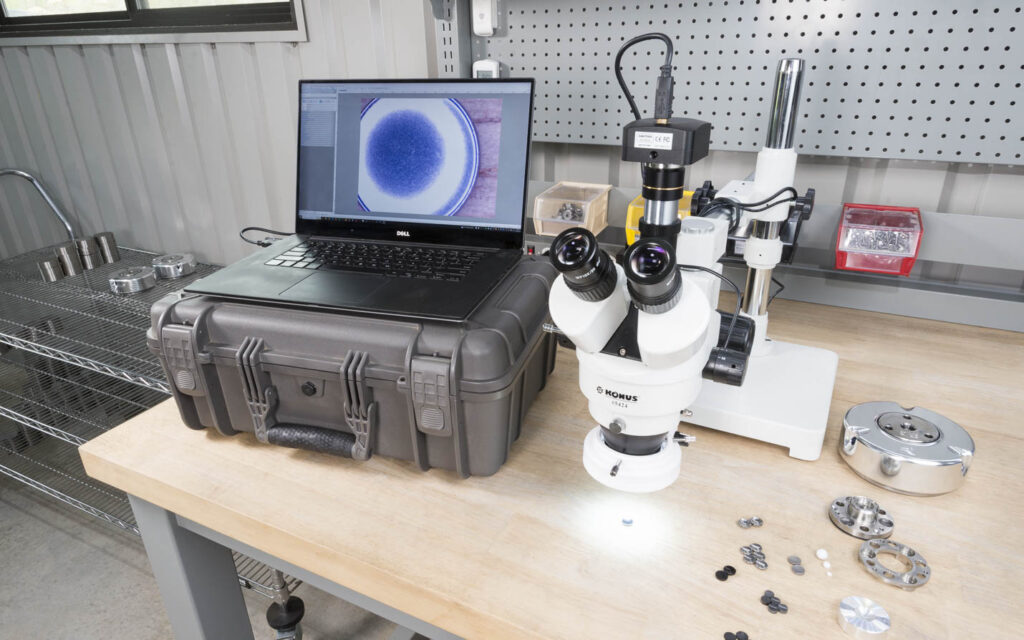
We sought to measure the vibration isolation performance of several popular audio footer designs. We then measured our Carbide Base footers under the same criteria for comparison. Vibration isolation was measured for each audio footer in horizontal and vertical directions. Three different vibration sources were utilized to generate vibrations: an electromagnetic vibration table, a subwoofer, and a 2-way loudspeaker. In each experiment, four audio footers were placed on top of the vibration source and then an aluminum plate was placed on top of the audio footers. Weights were bolted to the aluminum plate to simulate the mass of a loudspeaker or audio equipment having a total mass approximately 32 kg (70 lbs). Measurement Specialties ACH-01 piezoelectric accelerometer sensors were then attached to the plate with double sided tape to measure acceleration in the horizontal and vertical directions. The accelerometer sensors in turn fed into amplifiers calibrated for their respective sensors.

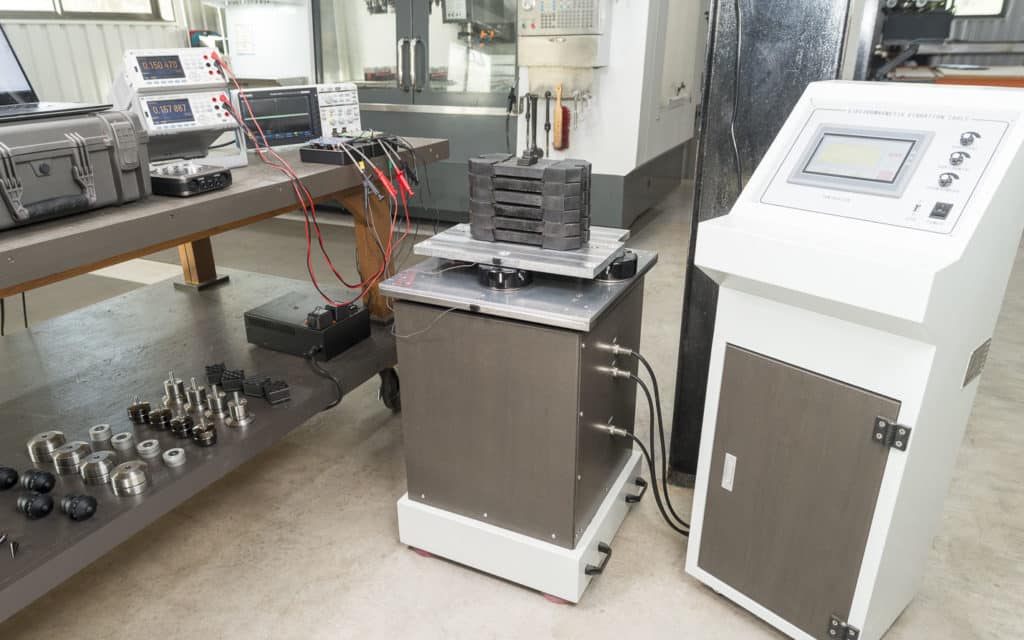
Electromagnetic Vibration Table

An electromagnetic vibration table was used to obtain the first set of measurements. The table was digitally controlled to precisely modulate the vibration amplitude and frequency of the table surface. To determine the vibration amplitude of the table, an accelerometer sensor was attached to the table and then a multimeter was used to measure the output of the sensor amplifier. The same was done with a second accelerometer sensor attached to the aluminum plate. Measurements were taken from the plate sensor in 5 Hz intervals from 10 Hz to 200 Hz. The vibration table was adjusted at each interval to ensure the table vibrated with an acceleration of 2.5 m/s2. The measurements were first conducted with the sensors attached to the forward facing edges of the table surface and plate to measure horizontal vibrations. The measurements were then repeated with the sensors attached to the tops of the table and plate to measure vertical vibrations. These measurements were focused on the bass frequency region in order to determine the vibration isolation performance around the resonance frequency of each audio footer.


The advantage of this experiment was that the table offered consistent vibrations across the measurements. This allowed resonances in the audio footers to be clearly identifiable. The disadvantage of this experiment was its limited resolution due to the spaced measurements. This experiment also did not offer any insight into the vibration decay behavior.


Subwoofer

A subwoofer was used as a vibration source to obtain sweep measurements in the bass frequency region. A PC was used used to generate a log swept sine signal from 15 Hz to 200 Hz which was then played through the subwoofer. The accelerometer sensors were attached to the forward edge and top of the plate to simultaneously measure horizontal and vertical vibrations. The PC was used to record the output of the plate mounted sensors. The measurements were then translated into waterfall graphs showing the vibration decay. The Y-Axis of the waterfall graphs were set to to ignore noise floor artifacts, where 0 dBFS corresponded to the limit before clipping. The maximum SPL during the sweep was 93 dBA as measured on the floor of our reverberant factory at a distance of 1 m . The maximum horizontal cabinet acceleration experienced during the sweep was 2.4 m/s2.


2-Way Loudspeaker

A 2-way loudspeaker was used as a vibration source to obtain sweep measurements in the midrange and treble frequency regions. The experiment was conducted using the same process as the subwoofer experiment except that the sweeps were done from 200 Hz to 1 kHz for the midrange and 1 kHz to 10 kHz for the treble. Another difference was that the accelerometer sensor amplifiers were set to provide a +20 dB gain relative to the subwoofer measurements. The additional gain was applied due to the inherently lower vibration amplitude of higher frequencies. The higher gain also raised the noise floor, which required limiting the visible portion of the mid and high frequency waterfall graphs to avoid noise floor artifacts. The maximum SPL of the loudspeaker was also 93 dBA during the sweeps with the driving voltage held constant throughout all measurements. This maximum horizontal cabinet acceleration experienced during the sweeps was 1.9 m/s2.


The advantages of the subwoofer and loudspeaker experiments were that they offered a high resolution view of the vibration decay behavior of each audio footer. The disadvantages were that the vibration of the cabinets were not as consistent with frequency as it was in the vibration table experiment. The vibration behavior of the cabinets were consistent between measurements however, allowing for useful relative comparisons between audio footers. Each measurement was taken twice consecutively and then averaged to smooth irregularities in the vibration behavior of the cabinets.

Audio Footers Under Test

Audio Footer Designs

Seven different audio footer designs were tested. Spikes were also tested for a relative comparison. Four of each audio footer were placed under the aluminum plate. The devices which had the appropriate provision were bolted to the plate.


The audio footers tested fell roughly into two categories in regards to achieving vibration isolation: ball bearing and viscoelastic.


Ball Bearing

The audio footers 1, 3, and 6 are based on a commonly used concept[2] utilizing ball bearings rolling in curved bearing races. These bearing designs divert the transmission of vibrations, thereby reducing the vibrations passing through the device. Audio footer 5 diverts the transmission of vibrations by utilizing bearings in a patented stacked configuration. Carbide Base footers utilize bearings between flat bearing races with viscoelastic buffers used to center the device during vibrations.


Viscoelastic

The audio footer 2 utilizes molded glass fibers with viscoelastic properties. Audio footer 4 utilizes upper and lower viscoelastic elements joined with an oval cylinder in a patented configuration. Carbide Base footers utilize a tubular viscoelastic element called ViscoRing™ in a patent pending configuration.

Click on the Measurements text under each device to toggle visibility of its graphs.

Horizontal and Vertical measurements are shown on separate tabs.

Spikes

Dimensions:

Ø 14 mm (0.55″)

35 mm (1.4″) height

Construction:

Steel spikes

Spike Measurements (click to toggle)

Horizontal Vibration Table
10 Hz – 200 Hz Bass
Horizontal Subwoofer
15 Hz – 200 Hz Bass
Horizontal Loudspeaker
200 Hz – 1 kHz Midrange
Horizontal Loudspeaker
1 kHz – 10 kHz Treble
Vertical Vibration Table
10 Hz – 200 Hz Bass
Vertical Subwoofer
15 Hz – 200 Hz Bass
Vertical Loudspeaker
200 Hz – 1 kHz Midrange
Vertical Loudspeaker
1 kHz – 10 kHz Treble

Audio Footer 1

Dimensions:

Ø 45 mm (1.78″) (top section), Ø 70 mm (2.76″) (bottom section)

51 mm (2.0″) – 61 mm (2.4″) height

Max Weight for 4:

N/A

Height Adjustable:

Yes

Bolt Provision:

Yes

Construction:

Stainless steel body with 3 ceramic ball bearings riding in spherical bearing races.

Audio Footer 1 Measurements (click to toggle)

Horizontal Vibration Table
10 Hz – 200 Hz Bass
Horizontal Subwoofer
15 Hz – 200 Hz Bass
Horizontal Loudspeaker
200 Hz – 1 kHz Midrange
Horizontal Loudspeaker
1 kHz – 10 kHz Treble
Vertical Vibration Table
10 Hz – 200 Hz Bass
Vertical Subwoofer
15 Hz – 200 Hz Bass
Vertical Loudspeaker
200 Hz – 1 kHz Midrange
Vertical Loudspeaker
1 kHz – 10 kHz Treble

Audio Footer 2

Dimensions:

50 mm (2″) width x 50 mm (2″) depth

25 mm (1″) height

Max Weight for 4:

34.4 kg (76 lbs.)

Other versions available for different weights.

Height Adjustable:

No

Bolt Provision:

No

Construction:

Layers of heat-compressed high-density molded glass fibers sandwiched between steel plates. Textured rubber top and bottom.

Audio Footer 2 Measurements (click to toggle)

Horizontal Vibration Table
10 Hz – 200 Hz Bass
Horizontal Subwoofer
15 Hz – 200 Hz Bass
Horizontal Loudspeaker
200 Hz – 1 kHz Midrange
Horizontal Loudspeaker
1 kHz – 10 kHz Treble
Vertical Vibration Table
10 Hz – 200 Hz Bass
Vertical Subwoofer
15 Hz – 200 Hz Bass
Vertical Loudspeaker
200 Hz – 1 kHz Midrange
Vertical Loudspeaker
1 kHz – 10 kHz Treble

Audio Footer 3

Dimensions:

Ø 45 mm (1.75″)

24 mm (0.94″) height

Max Weight for 4:

N/A

Height Adjustable:

No

(Optional Upgrade)

Bolt Provision:

No

Construction:

Anodized aluminum body with 6 ball bearings riding in spherical bearing races between 3 separate layers.

Audio Footer 3 Measurements (click to toggle)

Horizontal Vibration Table
10 Hz – 200 Hz Bass
Horizontal Subwoofer
15 Hz – 200 Hz Bass
Horizontal Loudspeaker
200 Hz – 1 kHz Midrange
Horizontal Loudspeaker
1 kHz – 10 kHz Treble
Vertical Vibration Table
10 Hz – 200 Hz Bass
Vertical Subwoofer
15 Hz – 200 Hz Bass
Vertical Loudspeaker
200 Hz – 1 kHz Midrange
Vertical Loudspeaker
1 kHz – 10 kHz Treble

Audio Footer 4

Dimensions:

Ø 51 mm (2″)

43 mm (1.7″) height

Max Weight for 4:

55 kg (121 lbs.)

Other versions available for different weights

Height Adjustable:

Only when bolted

Bolt Provision:

Yes

Construction:

Upper and lower viscoelastic isolators in a housing connected together with an oval cylinder in a patented configuration. Directional design. All measurements taken with logo facing forward as recommended by the manufacturer.

Audio Footer 4 Measurements (click to toggle)

Horizontal Vibration Table
10 Hz – 200 Hz Bass
Horizontal Subwoofer
15 Hz – 200 Hz Bass
Horizontal Loudspeaker
200 Hz – 1 kHz Midrange
Horizontal Loudspeaker
1 kHz – 10 kHz Treble
Vertical Vibration Table
10 Hz – 200 Hz Bass
Vertical Subwoofer
15 Hz – 200 Hz Bass
Vertical Loudspeaker
200 Hz – 1 kHz Midrange
Vertical Loudspeaker
1 kHz – 10 kHz Treble

Audio Footer 5

Dimensions:

Ø 76 mm (3″)

57 mm (2.25″) height

Max Weight for 4:

N/A

Height Adjustable:

Only when bolted

Bolt Provision:

Yes

Construction:

Stainless steel body housing 5 separate stacks of ceramic bearings in a non-diametrically opposed patented configuration.

Audio Footer 5 Measurements (click to toggle)

Horizontal Vibration Table
10 Hz – 200 Hz Bass
Horizontal Subwoofer
15 Hz – 200 Hz Bass
Horizontal Loudspeaker
200 Hz – 1 kHz Midrange
Horizontal Loudspeaker
1 kHz – 10 kHz Treble
Vertical Vibration Table
10 Hz – 200 Hz Bass
Vertical Subwoofer
15 Hz – 200 Hz Bass
Vertical Loudspeaker
200 Hz – 1 kHz Midrange
Vertical Loudspeaker
1 kHz – 10 kHz Treble

Audio Footer 6

Dimensions:

Ø 45 mm (1.75″)

72 mm (2.8″) – 89 mm (3.5″) height

Max Weight for 4:

N/A

Height Adjustable:

Yes

Bolt Provision:

Yes (bolting required)

Construction:

Aluminum body with 3 ceramic ball bearings riding in spherical bearing races.

Audio Footer 6 Measurements (click to toggle)

Horizontal Vibration Table
10 Hz – 200 Hz Bass
Horizontal Subwoofer
15 Hz – 200 Hz Bass
Horizontal Loudspeaker
200 Hz – 1 kHz Midrange
Horizontal Loudspeaker
1 kHz – 10 kHz Treble
Vertical Vibration Table
10 Hz – 200 Hz Bass
Vertical Subwoofer
15 Hz – 200 Hz Bass
Vertical Loudspeaker
200 Hz – 1 kHz Midrange
Vertical Loudspeaker
1 kHz – 10 kHz Treble

Carbide Base Footer

Dimensions:

Ø 125 mm (4.9″)

56 mm (2.2″) – 74 mm (2.9″) height

Max Weight for 4:

32 kg (70 lbs.)

ViscoRing™ replaceable for higher weights

Height Adjustable:

Yes

Bolt Provision:

Yes

Construction:

Aluminum upper portion housing the ViscoRing™ viscoelastic member. Stainless steel lower portion housing ceramic bearings and viscoelastic buffers in a patent pending configuration. Measurements taken with Light ViscoRings™ installed.

Carbide Base Footer Measurements (click to toggle)

Horizontal Vibration Table
10 Hz – 200 Hz Bass
Horizontal Subwoofer
15 Hz – 200 Hz Bass
Horizontal Loudspeaker
200 Hz – 1 kHz Midrange
Horizontal Loudspeaker
1 kHz – 10 kHz Treble
Vertical Vibration Table
10 Hz – 200 Hz Bass
Vertical Subwoofer
15 Hz – 200 Hz Bass
Vertical Loudspeaker
200 Hz – 1 kHz Midrange
Vertical Loudspeaker
1 kHz – 10 kHz Treble

Disclaimers

These experiments simulated the vibration amplitudes experienced directly at the cabinet of a loudspeaker or subwoofer playing at moderate to high volume. Some audio footers may measure differently when isolating lower amplitude vibrations. Additionally, the mass being supported influences the performance of some audio footers, so changing the mass can change the measurements. Finally, these measurements were all taken with an approximately steady state sinusoidal vibration stimulus which is different from the dynamic state of music.

Conclusion

The vibration isolation performance of the audio footers tested varied significantly. In most cases, unwanted stray vibrations increased through the footers in the bass and lower midrange frequencies. In other cases, damping was insufficient causing resonances to continue long after the initial stimulus, as indicated by the long decay times in some of the waterfall graphs.


The Carbide Base footers were unique in their superior ability to isolate and damp the bass and lower midrange thus maximizing clarity across these frequencies.

References

[1] Katz, B. (2020). On the acoustic radiation from a loudspeaker’s cabinet. AES: Journal of the Audio Engineering SocietyConvention Paper 10405


[2] Kemeny, Zoltan A. “Mechanical signal filter.” US 6520283 B2, United States Patent and Trademark Office, 18 February 2003. Google Patents, https://patents.google.com/patent/US6520283B2

Viscoelastic polymers or elastomers are widely used in vibration control applications due to their inherently high level of damping. Elastomers can also effectively isolate low frequency vibrations by being formed in certain shapes. Shape factor is the term of art used to quantify the isolation performance of a given elastomer shape. The implication is that the lower the shape factor, the lower the potential resonance frequency. A low resonance frequency typically results in a wide bandwidth of vibration isolation. This is due to the isolation of vibration frequencies above the resonance frequency.


For most common shapes, shape factor is generally defined as:

Shape factor =
Average loaded surface area
Bulging surface area

The average loaded surface area is the average of the upper and lower surface areas supporting the load. The bulging surface area is the surface area free to bulge perpendicularly to the load.


The stability of an elastomer can become compromised below a certain shape factor as the material becomes increasingly tall and narrow. Some elastomer manufacturers recommend staying above a shape factor of 0.3 in order to prevent buckling – an issue that can cause the supported equipment to topple over.


When designing the ViscoRing™ elastomer utilized in the Carbide Base footers, a shape factor of 0.17 was planned. This was chosen in order to push the resonance frequency low enough so that the lowest audible frequencies could be effectively isolated.

Improving Stability

An experiment was conducted to test the ability of the ViscoRing™ to vertically support a load and avoid buckling. The experiment consisted of gradually applying mass and measuring the vertical deformation of the material. Weights were applied on top of the Medium ViscoRing™ in 1.13 kg (2.5 lbs) increments in a room temperature environment. The vertical deformation distance was plotted in the form of the stress-strain curve shown. The y-axis represents the stress or amount of mass applied, and the x-axis represents the strain or vertical deformation caused by the application of mass.

The red curve shows the ViscoRing™ alone without a housing. It can be seen that shortly after the initial application of weight, the material began to buckle and deform considerably under the load. The material did a poor job of supporting even a small mass which was to be expected given its extremely low shape factor.


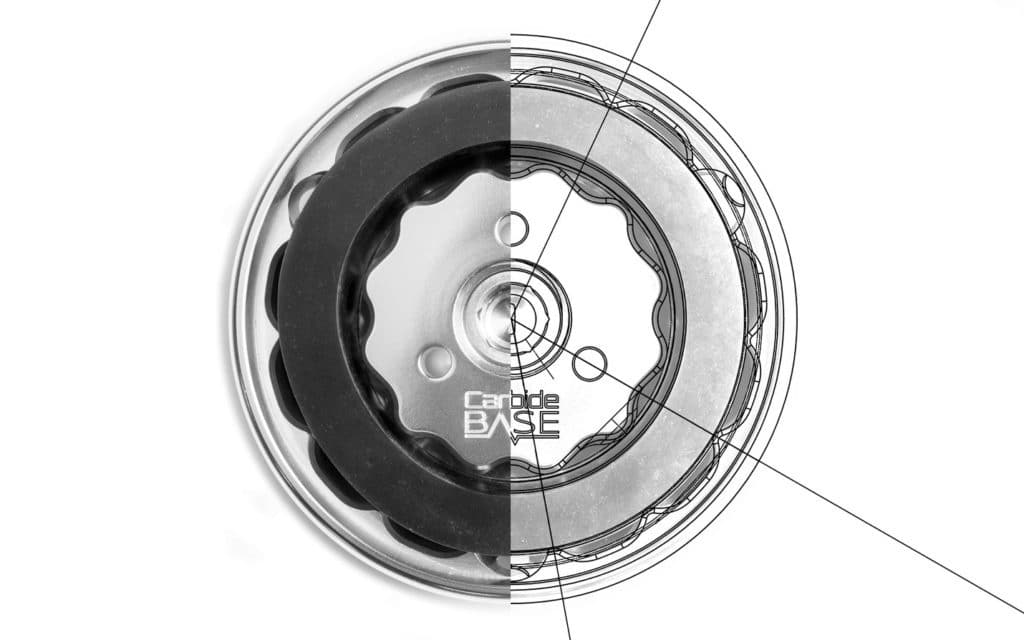
To improve the stability of the ViscoRing™, a housing was designed for it within the upper portion of the Carbide Base footer as shown in the simplified graphic. Ridges were added at spaced intervals around the perimeter of the ViscoRing™ to brace it and prevent buckling. The ridges were spaced apart so that surface area was free to bulge between the them thus preserving the benefits of the low shape factor.


As the ViscoRing™ bulged outward, a progressively larger percentage of the bulging surface area came into contact with the sloped ridges. This increasing shape factor with an increase in mass gave a more consistent resonance frequency across a broader range of load masses. Isolation performance of the Carbide Base footer became more constant across varying supporting masses with this progressive shape factor design.


The blue curve shows the same ViscoRing™ placed in the housing of the upper portion of the Carbide Base footer. A relatively linear increase in strain or vertical deformation with an application of stress or weight was observed. The material was not buckling as intended. The stiffness of the material eventually beings to gradually increase with increased stress as more of the unloaded surface area is braced. This desirably increased the maximum weight supporting ability of the material.


Elastomers are unable to be compressed into a smaller volume. Therefore, elastomers must be allowed to bulge outward in order to deform under a load. The selectively braced ViscoRing™ did not show a sudden increase in slope or stiffness as would have occurred if the material was prevented from further bulging. This is important, because a low stiffness or spring rate is necessary to achieve a low resonance frequency.

Improving Horizontal Isolation

Once successful in utilizing a low shape factor elastomer for vertical isolation, similar benefits for horizontal isolation were desired. Horizontally oriented low shape factor elastomers along with ball bearings were incorporated to further improve horizontal isolation performance.


Utilizing ball bearings to provide horizontal isolation is a well known concept. Many designs interpose ball bearings between curved bearing races. The curved bearing surfaces of other designs keep the bearings centered. They also allow for the transmission path of the vibration to be diverted as the upper and lower races translate horizontally relative to each other. This transmission-path evasion can enhance vibration isolation[1].


The design devised for the lower portion of Carbide Base footers was different, as the bearings rolled on flat rather than curved races. The horizontally oriented elastomers acted as highly damped springs keeping the device centered in response to vibrations. In order to minimize deformation and rolling resistance, zirconium was chosen for the bearings and polished hardened spring steel for the bearing races. Horizontal isolation was achieved with a higher level of damping than previous designs.

Vibration Testing

Measuring Horizontal Isolation

To asses the improvement in horizontal isolation another experiment was conducted. The goal of the experiment was to quantify the improvement the addition of the ball bearings and horizontally oriented elastomers provided for horizontal isolation.


An electromagnetic vibration table was used to generate vibrations for the experiment. The table was digitally controlled via a touch screen and dials wired to Variable Frequency Drives (VFDs). These were used to precisely modulate the vibration amplitude and frequency of the table surface.


Four Carbide Base footers with Medium ViscoRings™ installed were placed on top of the vibration table. A weighted aluminum plate with a total mass of approximately 45 kg (100 lbs) was then bolted on top of the footers. Two Measurement Specialties ACH-01 accelerometer sensors were used to measure vibrations. The first sensor was attached with double sided tape to the forward edge of the vibration table. The second sensor was similarly attached to the forward edge of the aluminum plate. Each sensor was hooked up to its own calibrated vibration sensor amplifier which in turn fed its own benchtop multimeter. The VRMS readings from each multimeter were used to separately determine the acceleration being experienced by the table and the aluminum plate with 1 mVRMS = 1 m/s2 acceleration.

Graphing Horizontal Isolation

The forward and back (Y axis) vibration frequency was set in 10 Hz increments from 10 Hz to 300 Hz. The VRMS values of both sensors were plotted at each interval. The amplitude of the table was adjusted to ensure that the table was oscillating sinusoidally with an acceleration of approximately 4 m/s2.


Subtracting the output of the plate sensor by the output of the table sensor yielded the transmission of vibrations through the Carbide Base footers. Positive values indicated an amplification of vibrations through the device. This was expected at vibration frequencies around the resonance frequency of the device. Negative values indicated a reduction in vibrations generated by the table. In other words, an isolation of vibrations which was desired. The more negative the value, the greater the isolation.


The red line shows measurements taken with the Carbide Base footers missing the ball bearings and horizontally oriented elastomers. Only the ViscoRing™ elastomer was being utilized for horizontal isolation. The blue line shows measurements taken with the bearings and horizontal elastomers in place. The incorporation of ball bearings and horizontal elastomers substantially improved the horizontal isolation performance. The reduction in vibration amplitude was particularly pronounced around the resonance frequency indicating a higher level of damping.

Conclusion

Several design features were incorporated into the Carbide Base footers to reliably utilize low shape factor elastomers for the purposes of low frequency vibration isolation. Elastomers formed in shape factors that were previously considered too unstable were made sufficiently stable with a properly designed housing. The additional combination of bearings and horizontally oriented elastomers further improved horizontal isolation. These novel features were later incorporated into a pending patent.

References

[1] Kemeny, Zoltan A. “Mechanical signal filter.” US 6520283 B2, United States Patent and Trademark Office, 18 February 2003. Google Patents, https://patents.google.com/patent/US6520283B2

It is known that a loudspeaker enclosure contributes significantly to the total radiated sound at its lower resonance frequencies[1]. Even though the surface velocity of the panels of a loudspeaker is small, the panels radiate with an efficiency many times greater than that of the drivers. This is due to the large radiating area of the panels relative to the radiating area of the drivers. Sound radiating from the enclosure panels can impart audible distortion and should be mitigated. Damping the enclosure panels is one effective way to reduce the amplitude of resonances[2].


The goal of this experiment was to determine if placing Carbide Base footers under a loudspeaker could reduce low frequency resonances within panels of the loudspeaker enclosure. The reduction in panel resonances would help quantify the improvement in vibration dissipation provided by the footers. This improvement would be compared to the base case of a loudspeaker enclosure sitting on steel floor spikes on a concrete floor.

Test Loudspeaker

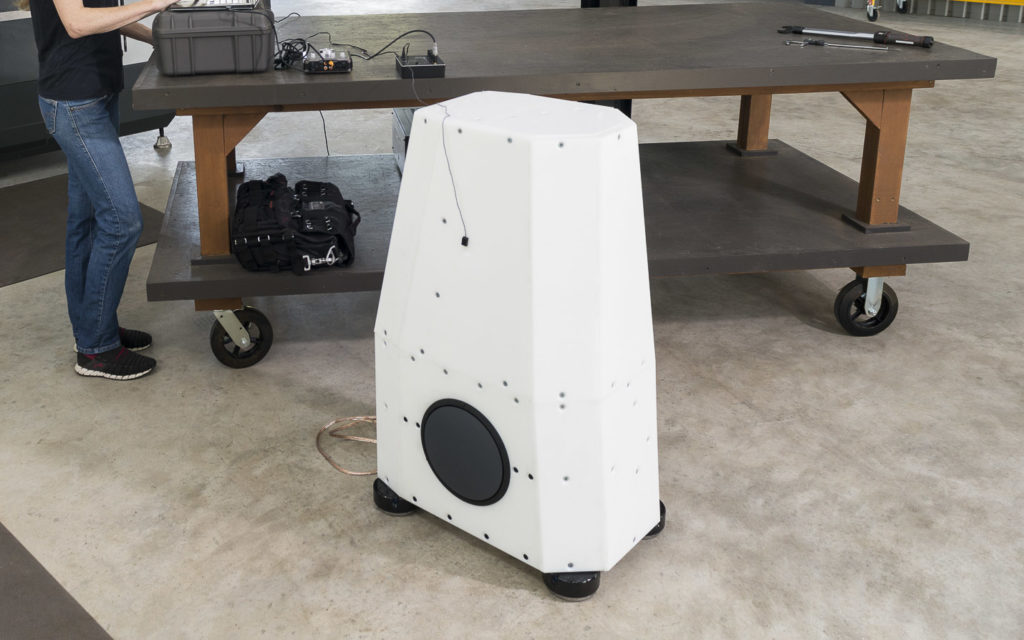
To perform vibration tests, we first constructed a test loudspeaker enclosure. We created our own enclosure to minimize the unknown variables which could influence the measurements. The enclosure was machined out of High Density Polyethylene (HDPE) sheets with 25 mm (1 in) thick panels used on the exterior and 50 mm (2 in) thick panels utilized for the internal bracing. Two Accuton AS250-6-552 250 mm (10 in) woofers were mounted on opposing sides of the enclosure. The enclosure was sealed with an internal volume of 129 liters yielding a Qtc of approximately 0.64. No stuffing was present inside the enclosure. The total mass of the enclosure with the woofers mounted was 83 kg (183 lbs.).

Measurements

In our vibration dissipation experiment, the measurements were taken on exterior panels of the loudspeaker enclosure. The first set of measurements were taken on the bottom center of the enclosure. The second set of measurements were taken on upper portion of the left side panel at a height 76 cm (30 in) above the bottom of the enclosure. Measurements were first taken with the enclosure sitting on steel floor spikes directly contacting a concrete floor. The same measurement was then taken again with the enclosure sitting on Carbide Base footers.


To measure vibrations we utilized a Measurement Specialties ACH-01 piezoelectric accelerometer sensor. The sensor was attached to the enclosure using double sided tape. An amplifier with an integrated analog signal processor was used to amplify the analog output of the ACH-01 sensor. The amplifier was calibrated for the sensitivity of this particular ACH-01 sensor allowing for absolute acceleration measurements. In turn, the sensor amplifier fed its analog output into a Tascam US-366 USB interface which was used to record the signal digitally on a PC. A log swept sine signal from 35 Hz to 200 Hz was fed into a Class AB amplifier which powered the woofers with a 3.8V driving voltage.


Waterfall graphs were generated to show the decay of the vibration amplitude over time. The y-axis represents dB below full scale of the recorded signal relative to the maximum peak level before clipping. The y-axis was limited to a minimum of -60 dBFS to avoid noise floor artifacts.


The blue waterfalls represent measurements with the enclosure on Carbide Base footers and the red waterfalls represent with the enclosure on steel floor spikes directly contacting the concrete floor.

Bottom Panel

On Floor Spikes
On Carbide Base Footers

Upper Side Panel

On Floor Spikes
On Carbide Base Footers

Results

Measurements confirmed that low frequency resonances within the panels of our test loudspeaker enclosure were subdued when the loudspeaker was placed on Carbide Base footers instead of floor spikes. This damping effect occurred not just locally near contact with the footers but also at a location near the opposite end of the enclosure. The amplitude and decay time of most of the resonances present in both panels was reduced when the loudspeaker was on the Carbide Base footers. One notable exception was the resonance around 150 Hz in which there was a decrease in amplitude and an initially faster decay, followed by a small increase in decay time below -40 dBFS. In the lowest frequency region where enclosure resonances are most audible, the vibration amplitude was reduced in some instances by over 80%.

References

[1] Bastyr, K. J., & Capone, D. E. (2003). On the acoustic radiation from a loudspeaker’s cabinet. AES: Journal of the Audio Engineering Society51(4), 234-243.

[2] Juha Backman, Effect of panel damping on loudspeaker enclosure vibration, 1996, Nokia Mobile Phones, Finland.